
If you’re a marketer or any other type of professional, understand the importance of visual content in keeping your audience interested. But what are infographics, and how to create an eye-catching infographic in minutes?
In this blog post, we’ll answer those questions and more. Infographics are a kind of visual content that combines text and graphics to communicate information. They can be used to explain complex concepts or to highlight statistics and data.
So if you’re seeking a way to make your visuals stand out, infographic creation is the way to go!
Table of Contents
What Is an Infographic, and Why Do You Use Them?
Infographics are the perfect medium to share information with your audience. They’re engaging and easy to understand, which makes them great for marketing campaigns or tutorials that need brief yet informative explanations of complex topics such as coding languages, marketing strategies, and so on.
Infographic design has become increasingly popular over time due to its ability to not only tell stories but also convey useful data points without taking up too much screen space.
The Importance of an Infographic in the Content
The use of infographics has exploded in recent years as more and more businesses have started to see the value of this type of content. There are many reasons why you should use infographics as part of your content marketing strategy. Here are just a few:
- Infographics are visually appealing and can help break up text-heavy content.
- They can communicate complex ideas quickly and easily.
- They are shareable, which means they have the potential to go viral and reach a larger audience.
- They can help improve your search engine optimization (SEO) by increasing your click-through rate and generating backlinks to your website.
How to Create a Powerful Infographic That Will Get Attention
An infographic is a visual way to represent information. They can be used to communicate data, statistics, or any other complex information in a user-friendly format. Infographics are especially helpful when trying to convey large amounts of data in a small space. Unlike traditional text-based articles or reports, infographics use images and graphics to tell a story. This makes them more visually appealing and easier to digest. When used correctly, infographics can be an effective way to communicate your message.
There are a few points you need to know about creating an infographic. First, you need to decide what story you want to tell? What information do you want to communicate? Once you’ve decided on your story, you need to gather your data. This can be done through research, surveys, or any other data-gathering methods you deem necessary.
Creating an infographic doesn’t have to be complicated or time-consuming. With a little planning and some basic design skills, you can create an infographic that is both informative and visually appealing.
Here’s a comprehensive guide on how to create an infographic:
- Choose a topic for your infographic.
- Do your research.
- Find data to support your topic.
- Create an outline or wireframe for your infographic.
- Design your infographic using online tools or software.
- Use editable infographic templates.
- Share your infographic with the world.
- Measure the results.
Choose a Topic for Your Infographic
When it comes to creating an infographic, choosing the right topic is essential. The best topics for infographics are those that are timely and relevant to your audience. For example, if you’re creating an infographic for a healthcare website, you might want to focus on a current health trend or medical breakthrough. Additionally, it’s important to choose a topic that is truly visually interesting. After all, infographics are all about presenting information in a way that is easy to understand and digest. So choose a topic that you know will be engaging and informative, and your infographic is sure to be a success.
Do Your Research
Once you’ve selected a topic, it’s time to do your research. Gather as much information as you can on your chosen topic, and then begin to organize that information in a way that makes sense. Remember, infographics are all about visualizing data, so try to find data that is interesting and easy to understand. Additionally, be sure to include sources for all the information you include in your infographic. This will not only add credibility to your work, but it will also help others who want to learn more about the topic you’re discussing.
Find Data to Support Your Topic
If you’re looking to create an infographic, the first step is to find data that supports your main point. This could include statistics, percentages, or other facts and figures. To find reliable data, visit government websites, research journals, or think tanks. When you have gathered your data, you can start designing your infographic. Keep in mind that your objective is to communicate your information clearly and concisely. Use visuals and easy-to-understand language to make your point. A little imagination and persistence will allow you to craft an engaging and informative infographic that will help your readers better to understand your message.
Create an Outline or Wireframe for Your Infographic
You have collected all the needed content as a foundation for your completed infographic. So next, you can begin to consider how you’ll design this masterpiece. A fantastic way to do this is by creating an infographic framework or wireframe, which you can then fill out with content. This will help you to visualize the layout and flow of your content and make sure that everything fits together nicely.
If you are unsure where to begin, there are a few different ways to create an infographic outline:
- Use a drawing tool like Photoshop, Illustrator, or Inkscape to create a basic layout.
- Find a ready to use template online or in a graphic design program that you can create as a starting point.
- Use a tool like Google Drawings to create a simple wireframe.
Once you’ve prepared your outline, you can start adding your content. Place each piece of content into its own section, and make sure to leave space for images, charts, and other visuals. As you add in your content, start thinking about how you want to visually represent it. Do you want to use icons, images, or charts? How can you make the information easy to understand and digestible?
Design Your Infographic Using Online Tools or Software
Once you have your infographic content ready, it’s time to start designing. Don’t worry if you’re not a designer or aren’t familiar with advanced designing software. There are plenty of online tools that make it easy to create an infographic from start to finish, without any design experience required.
Some of our favorite tools for creating infographics include:
Canva: Canva is a user-friendly graphic design tool that is perfect for creating infographics. With over 1 million templates and tools available, all with varying levels of complexity, you can create an infographic that’s perfect for your needs.
Adobe Spark: Adobe Spark is another great option for creating infographics. With Spark, you can create graphics, web pages, and videos in minutes, with no design experience required.
Venngage: Venngage is a good choice if you don’t want to spend a lot of time creating designs. With Venngage, you can create a graphic in just minutes, even if you have no background in the field.
Piktochart: Piktochart is an easy-to-use infographic maker that’s perfect for those who want to create infographics without any design experience. With Piktochart, you can create an infographic in minutes, with no design experience required.
Once you’ve chosen a tool or software to design your infographic, it’s time to start creating. Depending on the tool you’re using, the process will vary. However, most tools follow a similar process:
Choose a template: Most tools will offer a variety of templates to choose from. Choose a template that’s appropriate for the kind of infographic you’re trying to create.
Add your content: Once you’ve chosen a template, you can start adding your content. Add your text, images, and data to the infographic template.
Customize your design: Once you’ve added your content, you can customize your design. Change the colors, fonts, and layout of your infographic to suit your needs.
Download and share: Once you’re happy with your design, you can download your infographic or share it directly on social media.
Use Editable Infographic Templates
Designing an infographic from scratch can be time-consuming and requires special design skills. If you don’t have the time or skills to create your own infographic, you can use an infographic template. There are many sites offering the best free or premium infographic templates that allow you to conveniently download infographics. When using an infographic template, be sure to customize it to fit your own branding and style.
Share Your Infographic with the World
You’ve put a great deal of time and effort into creating your infographic, and now it’s time to share it with the world. There are different ways to do this, and the best method will depend on your goals and audience. Here are a few thoughts to get you started.
If you want to reach a large audience, consider posting your infographic on social media or submitting it to infographic directories. If you are attempting to target a definite group or promote your brand, you may want to consider guest blogging or emailing your infographic to influencers in your industry. You can also embed your infographic on your website or blog. When sharing your infographic, be sure to include a call-to-action (CTA) to encourage people to view it.
Measure The Results
After you’ve promoted your infographic, it’s important to measure the results. How many people have viewed it? How many people have shared it? How much traffic has it generated to your website? Employ Google Analytics or another similar solution to track these metrics. By evaluating the usefulness of your infographic, you will know exactly how effective it is and whether it’s worth making more in the future.
Get more info: Are you interested in learning how to make a project management timeline from beginning to end? Check out this article to learn how to handle the problems associated with the project, and how tasks are connected to each other.
Quick Tips to Improve Your Infographic Design
An infographic is a great way to communicate complex information in a visually appealing and easy-to-understand format. But if you’ve never made one before, the process can seem a bit daunting. Here are a few quick pieces of advice to help you create an infographic that will engage and inform your audience:
Start with a Strong Visual Concept
The initial step in creating an infographic is to come up with a strong visual concept. This can be anything from a simple color scheme to a more complex data visualization. Think about what would make your infographic stand out and what kind of information you want to communicate.
Keep It Simple
Once you have your visual concept, it’s important to keep your design simple. Too much information can be overwhelming and make your infographic difficult to understand. Stick to the most important points and use clear, concise language.
Use High-Quality Visuals
In order to make your infographic look professional, be sure to use high-quality visuals. This includes both images and data visualizations. If you’re unsure how to create a particular visualization, there are plenty of resources available online.
Stick to a Single Topic
When planning your infographic design, be sure to focus on a single topic. Trying to stuff too much information into one infographic can make it confusing and difficult to follow. Choose one aspect of your topic to focus on and stick to it.
Use Data Visualizations
One of the best approaches to make complex data more understandable is to use data visualizations. When used correctly, data visualizations can make your infographic more engaging and easier to understand.
Make It Shareable
Once you’ve created your infographic, be sure to make it easy for others to share. Include social media buttons and embed code so that viewers can easily post your infographic on their own websites and blogs.
Follow these tips, and you’ll be on your way to creating an infographic that will engage and inform your audience. With a little effort, you can make complex information more accessible and help your audience understand it better.

Get the best: Digital marketing is important for businesses for a number of reasons. It enables everyone to reach a wide audience quickly and efficiently. To easily handle your daily digital marketing responsibilities, take advantage of the best digital marketing PowerPoint templates.
The Best Presentation Templates to Make Your Infographic Stand Out
You have now learned how to make an infographic with easy steps and the tools to help you. Creating infographics with graphic designing tools is easy, but creating a visually pleasing one will take time. If you do not have enough time or are always too busy, it is recommended to download the best infographic PowerPoint (PPT) templates. It can be arranged in minutes, so you’re not going to waste any time struggling to come up with it.
When using these classy premium presentation templates, all you need to do is drag and drop, and they’re ready to go. Premium slides have various features, including a variety of built-in graphical components packed. Many free presentation templates are downloadable online. The main issue is that the number of slides in these templates will be less, or various features will be missing.
We have listed a collection of the finest-recommended infographic slides below. Check out the listed options here.
Timeline Bundle Infographic Diagrams PowerPoint Template
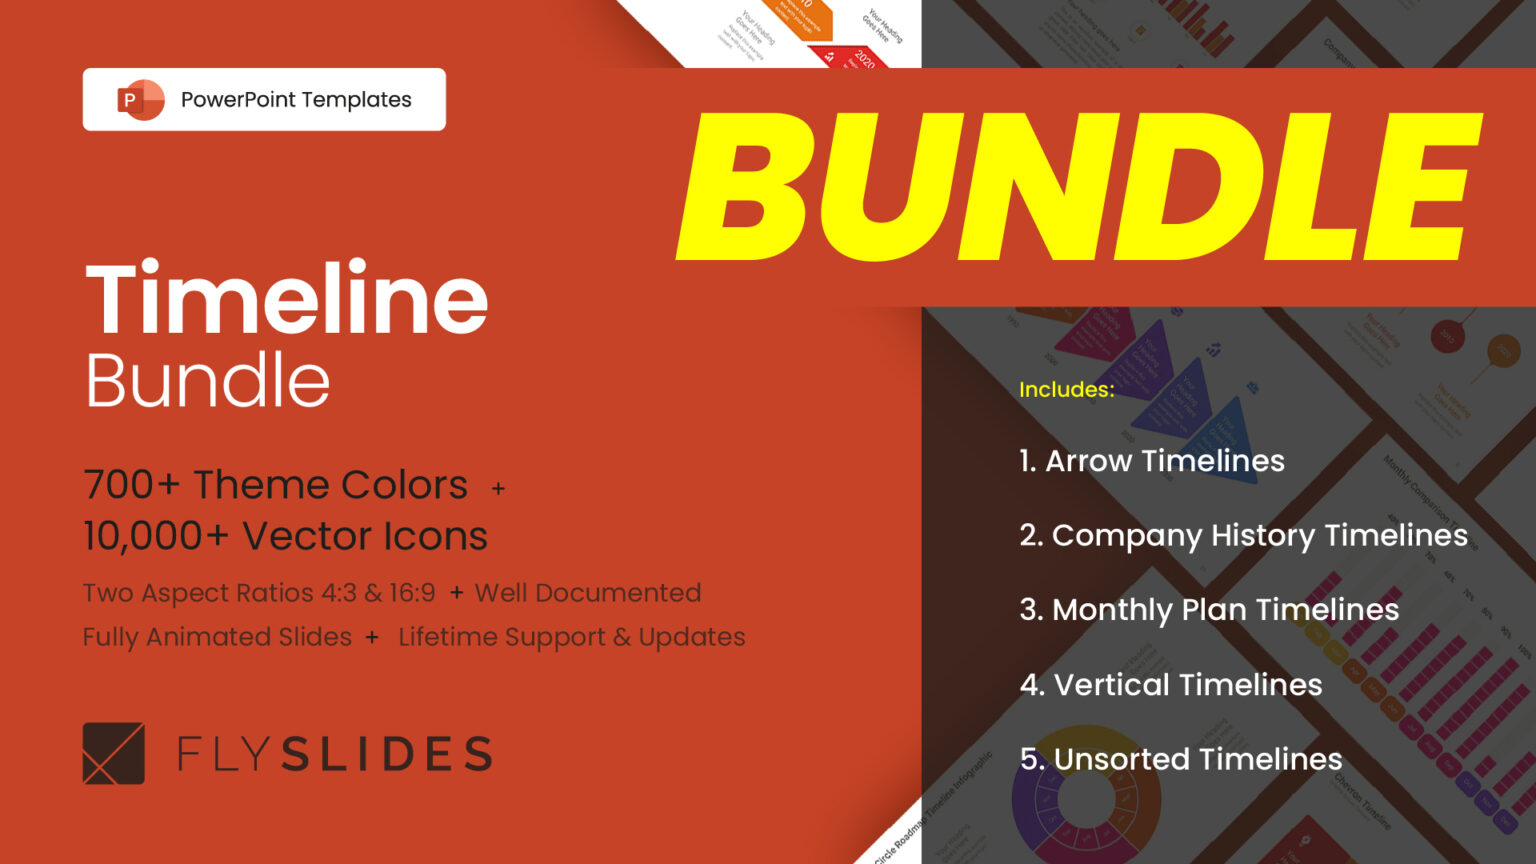
This PowerPoint timeline infographic bundle consists of a collection of company history timelines, chevron arrow timelines, monthly plan timelines, vertical timelines, and unsorted timeline templates. Rather than buying all these PPT templates individually, you can purchase this one template and save money. As you are getting this single bundle, you will get access to all four products at the best price, and you will receive updates for all of them.
Unsorted Timelines Infographic Diagrams PPT Template
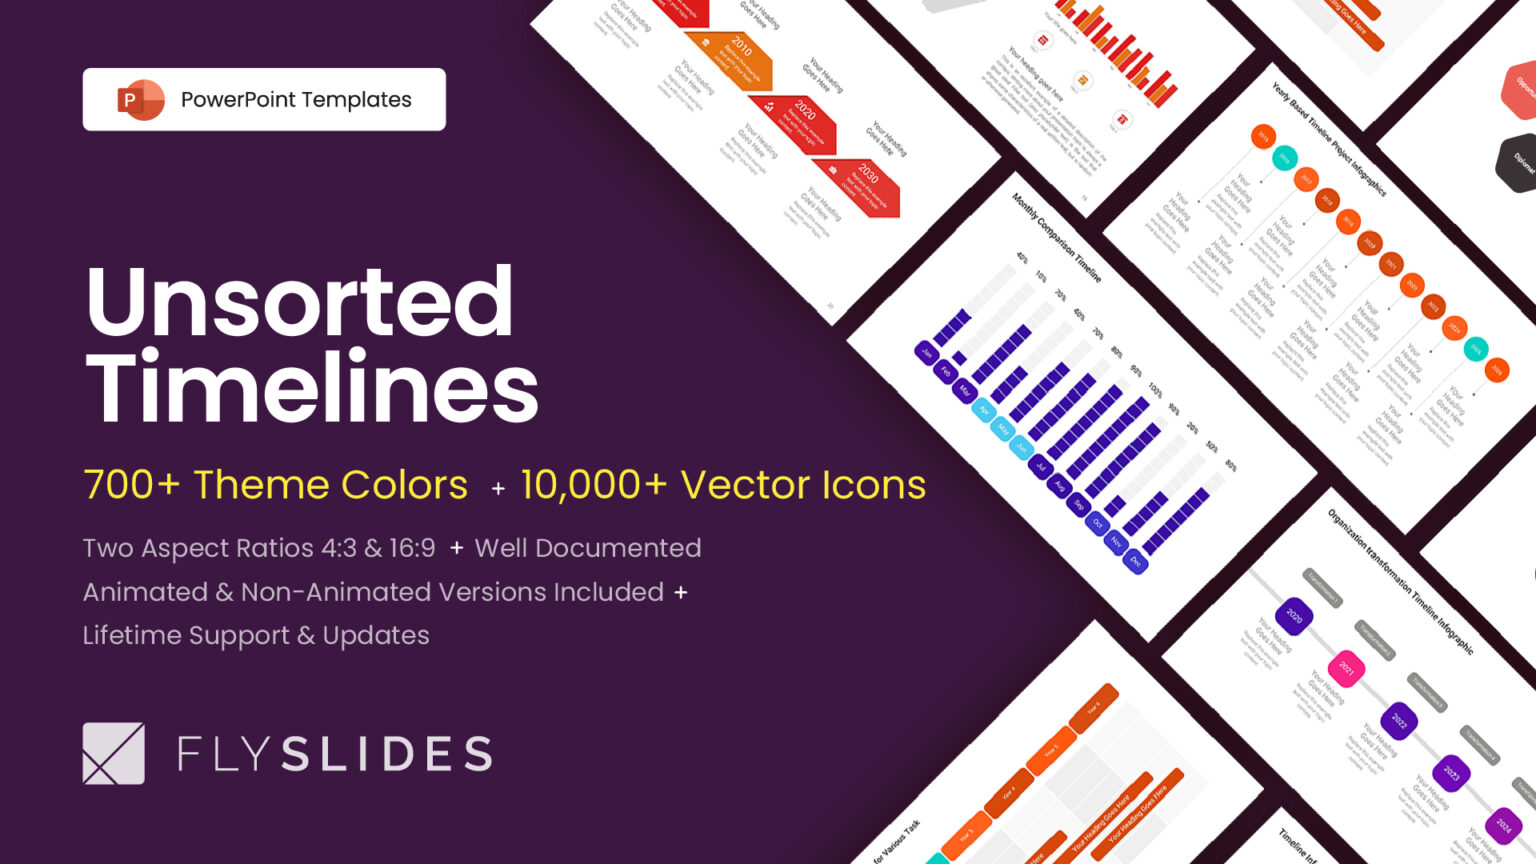
If you want to download PowerPoint templates that include unsorted timelines infographic diagrams, then this is the right one for you. This unsorted timeline infographic PowerPoint template is ideal for presentations that necessitate an overview of events or milestones that are not in chronological order. This infographic template makes it easy to highlight numerous events or milestones on a single slide.
Best Vertical Timeline Infographic Template
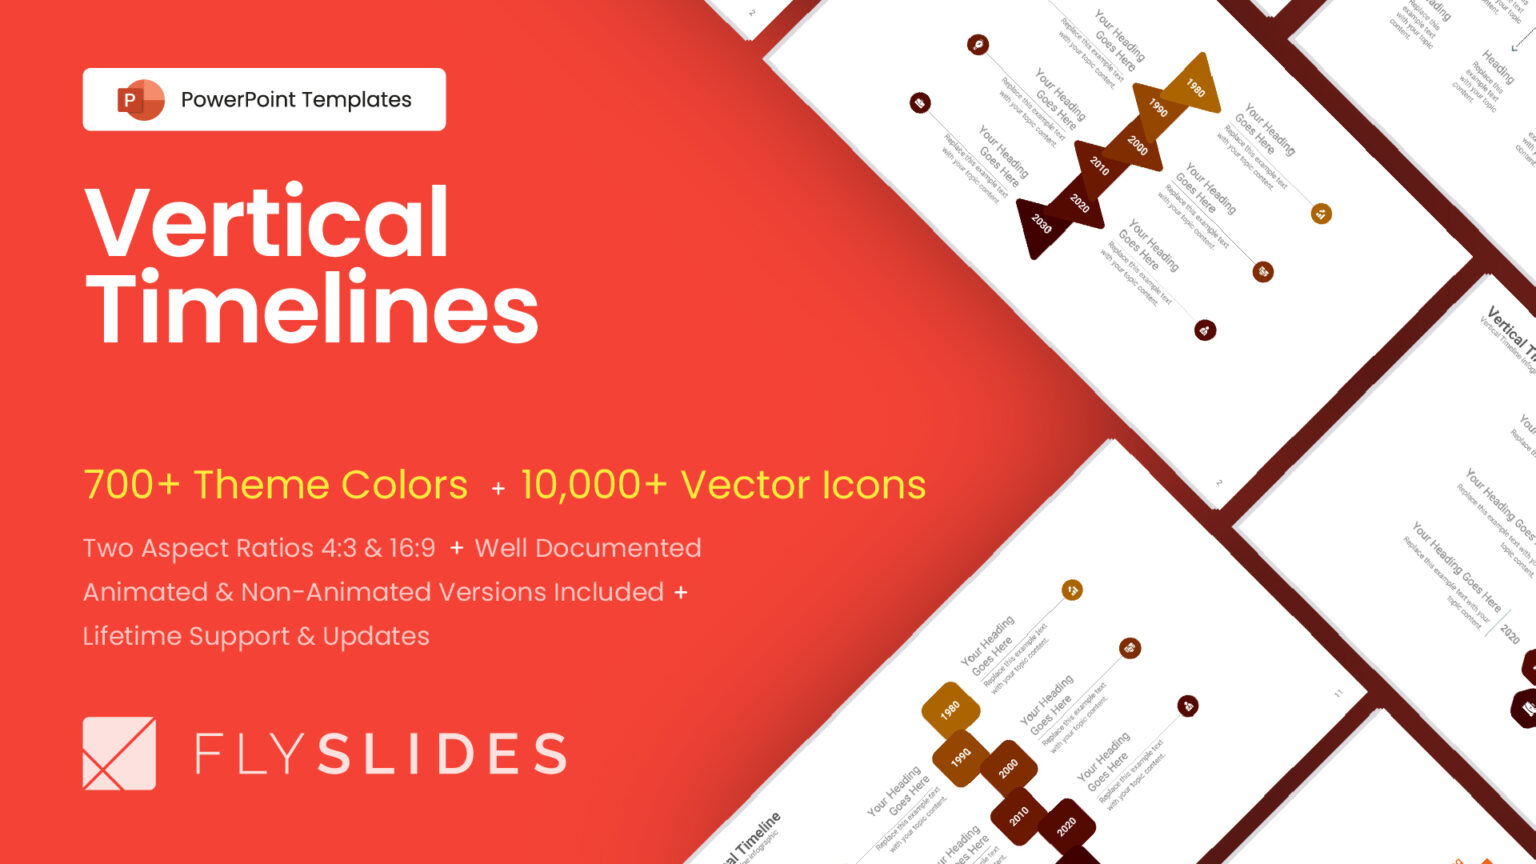
Vertical timeline diagrams are used to display a sequence of events in chronological order. The events are usually represented by bars or blocks, and different colors can be used to describe different categories of information. One of the benefits of using a vertical timeline diagram is that it makes it easy to see how different events are related to each other. This can be especially useful when trying to track down the source of a problem or when trying to understand the sequence of events that led up to a particular outcome.
Vertical timeline diagrams can also be used to show progress over time. For example, you could use a vertical timeline diagram to track the development of a project from start to finish. Vertical timeline diagrams are the most efficient method to visualize relations, progress, and outcomes. Use these professional PowerPoint slides to bring a convincing business look.
Monthly Plan Timeline PowerPoint Presentation Template
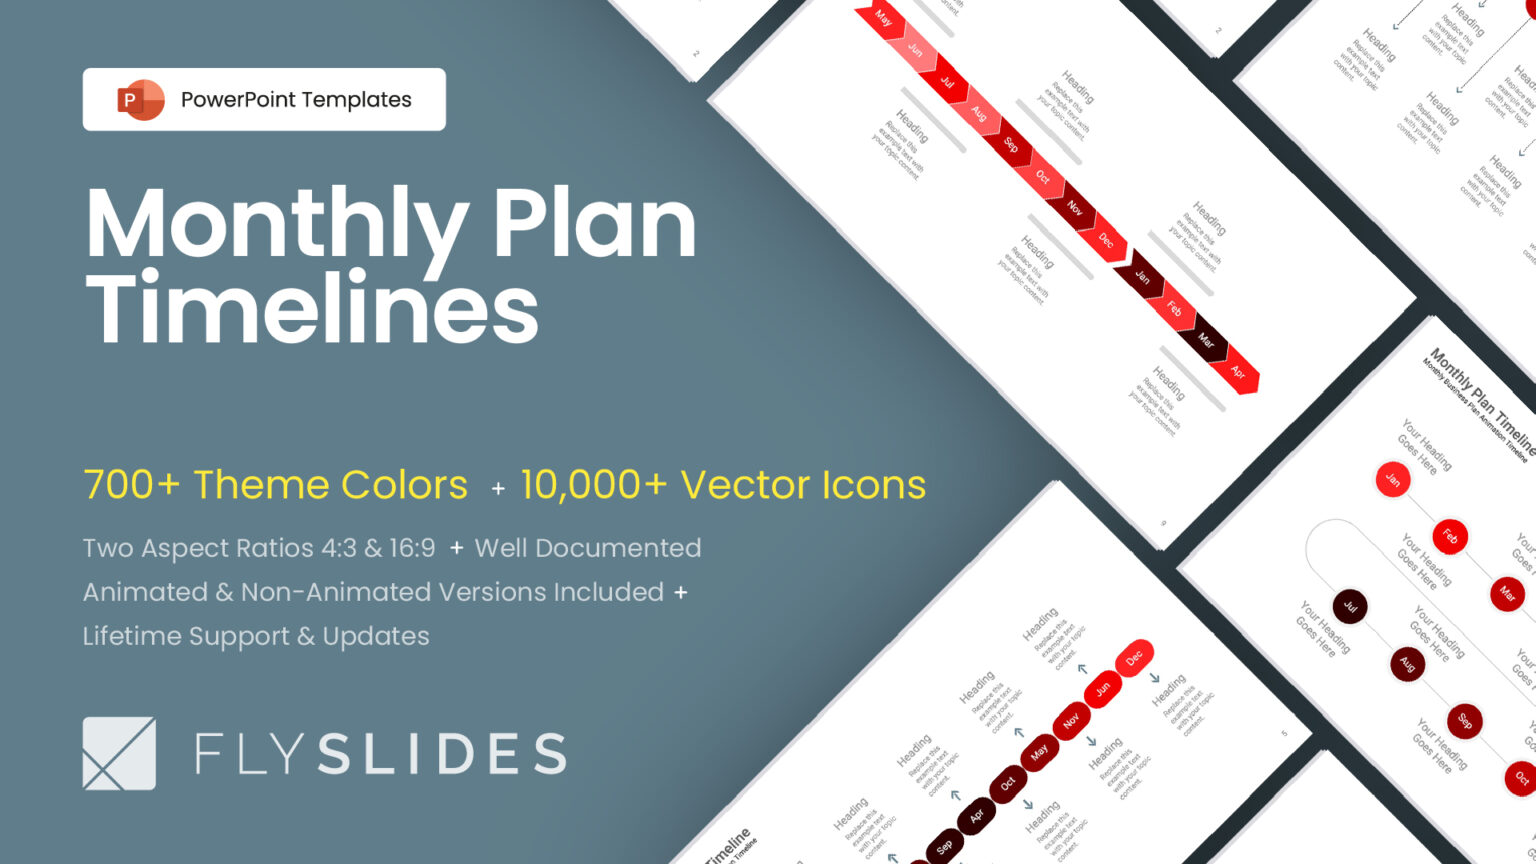
Monthly plan timelines are used to help individuals and organizations track, manage, and allocate their resources for specific periods of time. They allow users to visualize their tasks and goals by plotting them. Monthly plan timelines are especially helpful when planning long-term projects or tracking multiple deadlines simultaneously. These PowerPoint slides are completely customizable and available for downloading and continuous updates.
Best Company History Timeline Infographic Template
A company history timeline is an excellent way to keep track of all the important events and milestones in your company’s history. It can be considered as a reference document for current and future employees, as well as customers and partners. A company history timeline can also help you track how your company has evolved over time. This PowerPoint template is best when showing your company’s objectives, advancements, and outcomes.
If you want other versions of the infographic PowerPoint template, then you may look at infographics Google Slides themes and infographics Keynote templates.
Creating an infographic may be a wonderful technique to communicate complicated information in a visually appealing and easy-to-understand style. But if you haven’t done one previously, the method can look a little scary. Rendering an infographic isn’t as complicated as it may initially look. Breaking the entire process down into easy steps will enable you to design a cool infographic that will help inform and engage your viewers.
There are some great tools, and best ready-to-use infographic templates are available to help you make an infographic, even if you don’t have any design experience. With a short period of time and effort, you can create an infographic that will be a great addition to your content marketing arsenal.